

By Francesco Caruso, MFTA, Global Asset Strategy Amber SICAV advisor
This brief paper deals with liquidity and its current non-role as an investment form, but it is also a meditation on why the market accepts (and, actually, tries to rationalize) distortions of evaluation and prolonged asymmetries, such as those in place on several major financial markets.
The first step is to photograph the reality. There is a bubble that continues to develop on the US stock market (particularly on some sectors and big caps) and that it is still alive on most of the debt (on historical record vs GDP) and hence on the bond world, which is far away from its fair values between income and historical volatility. Connected as a communicating vessel with this first bubble there is a second, more subtle, new, intellectually intriguing bubble, with no history, and this is the bubble regarding the massive transit towards passive instruments (ETFs) and strategies. Both have clear causes and are partly related to the same origin: forced (first) and voluntary (after) Central Banks’ policies regarding the stifling of risk-free performance.
To understand what is going on, it is necessary to focus on the second bubble, the one on passive instruments and strategies, perhaps less obvious but much more pervasive and in my opinion characterized (we will see it later) from having a reciprocal feeding with the first one.
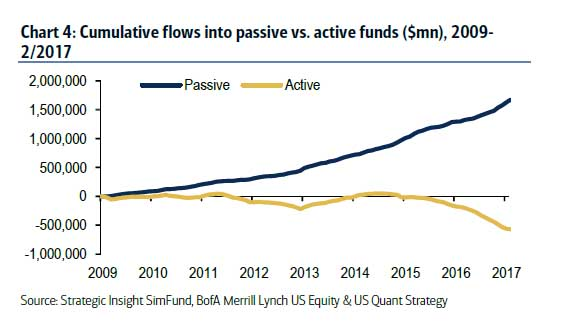
The starting point of this analysis is the combination of passive strategies and passive instruments (ETFs). The concept of passive investment implies having a steady long exposure to shares and bonds and is nothing particularly new. Passive investment through ETFs has gained and is gaining in an objective and massive way: ETFs currently amount to 2.6 trillions and a large consulting house projects that these numbers will double by 2020, all (or almost all) at expense of active portfolio management. The popularity and spreading of ETFs have deeply changed the asset management business. In fact, asset management that works “long only” with active strategies and higher costs and using specific strategies to outperform markets, is now called to prove its value each year with respect to passive investment, with the only alternative of risking heavy redemptions.
Numbers show that most of these active strategies are based on concepts that have prevailed and functioned until 2009-2010 but that have been working pretty bad in recent years also because these strategies are based on a logic of symmetry between valuations and risks that seem to have become obsolete in this world, where central banks play a very active role in supporting and controlling markets.
The concept of risk seems to evaporate very quickly. We come from years and years of profitable bond markets due to the fall in interest rates and we also come from years – post 2009 – of stock markets which on average have been the best performers among the various asset classes: so if we were to look at market statistics of the last eight years only, what the numbers testify is that passive instruments have dominated and that the simplest passive mixes between stock indices and bonds (perhaps with a pinch of gold) have outperformed other refined strategies and have been the best investment both in terms of profit and efficiency, measured with the Sharpe Ratio.
The debate is thus shifting from the type of investment to the type of strategy, that is, active asset management towards passive asset management.
The evolution in terms of volumes of ETFs has suddenly sparked a major press campaign about a part of asset management, which (it has been said) over the last 35 years has charged ever higher fees to maintain a large human infrastructure of portfolio managers, analysts, administrative staff and distribution channels.
On one hand, there is a dynamic of investors migrating to low-cost passive vehicles because they have realized that high-cost active management has underperformed passive tools and strategies, especially from 2011-2012 onwards. In this sense, the investment market proves to be a rational market that pursues at all levels the strict logic of the Occam Razor: it is useless to do with more what can be done with less. The ETFs are decimating the asset of the most conventional funds under management but, interestingly, they also began to eat Hedge funds’ food. Why?
Certainly, investors who made this choice cannot be blamed: stocks have risen, especially the most important indexes, many active managers have underperformed and/or have been slow in reducing costs and in the past years central banks have actually worked as an insurance against excessive market volatility.
This setup has created an extremely challenging and complicated environment for conventional active managers while representing a strong, good wind for ETFs. Here comes the crucial point of connection between the two bubbles. A market that heavily invests in passive instruments forces an investment in the underlyings, regardless of any type of valuation. If there is an inflow in a ETF, the ETF must invest in the underlying, without discretion: discretion is left to the investor and therefore to the strategy.
The liquidation process of liquidity, useless and non-profitable dead weight, which accelerated after Brexit and Trump, represents a deadly bottle neck. In the absence of crisis factors, this investment process on passive tools and strategies can safely go on, at least as long as the liquidity tank is not reallocated and/or the flow of central banks will only be a rivulet or an outflow (as it is starting in the US: but the financial leverage continues to rise and it is on historical records). At that point, once the liquidity turning point has passed, markets will encounter a physiological plateau.
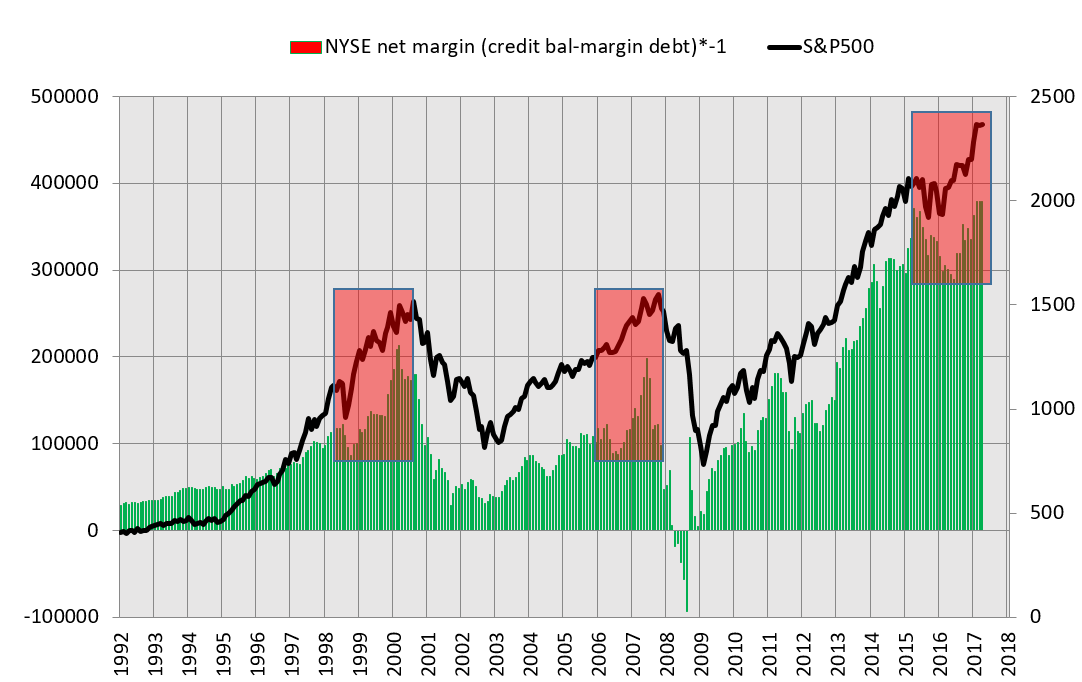 Chart Caption: The level of the US Margin Debt reaches new historical highs and thus erases the previous divergence. The situation looks very similar to those of 1999 and 2006-7, when – after a pause – both the index and the Margin Debt formed a last-minute boost. In 2015, already, the US financial leverage (which we can define as the speculative component of the stock market) has reached unprecedented peaks, thanks to the ease of indebtedness of individuals and companies (which translated into leverage positions and buybacks). No one can say how high this indicator can go: at least, we can’t even if we are studying the problem from the mathematical point of view. What we do know is that this indicator is sensitive to two factors: short-term interest rates and credit risk. Each top of the Margin Debt was recorded at the beginning of a phase not only and not so much of deteriorating equity markets as well as, in a broader sense, a contraction in the profitability of assets. We see this indicator for what it is: a clear signal of the importance of the leverage in the market and a potential multiplier of volatility in the event of financial shocks that lead to a widening of credit risk and hence to a systematic deleveraging.
Only a structural disinvestiment caused by endogenous or exogenous events could lead to a premature flow reversal, although in this sense the market is more fragile than what appears at first sight, due to record-to-lever exposure (net debt) on certain markets, which is likely to trigger sooner or later a deleveraging process.
Prudence collapses in the mind of the hungry beast and the hunger for yield is enormous, so great to have led even the most evolved investor to underestimate the concept of risk. The hungry investor then moves away from the discipline. In this regard, the present moment is already in many respects a photocopy of already seen phases.


")